How much should a Johns Creek pool builder spend on marketing?
Two pool builders. Same backyard skill. One spends $2,000 a month and books 3 jobs. The other spends $6,400 and books 11. The math isn’t about spend — it’s about market.
You’re guessing your budget against a market you can’t see.
Here’s the thing. Most pool builders I talk to in Johns Creek are picking a marketing budget the same way they picked their first truck — gut feel, what a friend said, and what’s left after payroll. There’s no benchmark for what your actual competitors are spending. So you guess. You spend $1,800 one month, $3,500 the next, $700 in the slow weeks, and you have no idea whether you’re under-investing or just throwing money at the wrong things.
Real talk: a pool contractor working the Rivermoore Park and Medlock Bridge corridor told me last spring that he was about to double his Google Ads spend because “that’s what I can afford.” His competitor — same skill, same crew size, slightly worse portfolio — was already running a full-funnel program at $6,400 a month and showing up in the top three Maps results for every neighborhood between McGinnis Ferry and State Bridge. Twelve months later, the second guy closed 11 projects to the first guy’s 3.
Same market. Same homeowners. Completely different math, because one builder bought visibility and the other bought hope.
The pool builders winning Johns Creek aren’t lucky. They’re spending at the level the $163,000 average project value demands — and treating marketing as the cost of being eligible to quote, not a discretionary line item.
The good news? Once you see the actual numbers, the budget question stops being scary. It becomes math. The rest of this guide breaks down what real Johns Creek pool builders spend, what they get for it, and where the line is between under-investing and burning cash.
Two pool builders. Same Johns Creek market. Different math.
The line between $2K and $6K isn’t 3x the leads. It’s a different category of buyer entirely.
| What you’re buying | $2,000/month builder | $6,400/month builder |
|---|---|---|
| Monthly inbound leads | 14–22 mostly shared | 48–62 exclusive |
| Average project value closed | $94,000 | $163,000 |
| Where leads come from | Angi, Yelp, neighbor referrals | Google Maps, organic, owned ads |
| Booked projects per month | 2–3 | 9–11 |
| Cost per booked project | $800–$1,000 | $580–$710 |
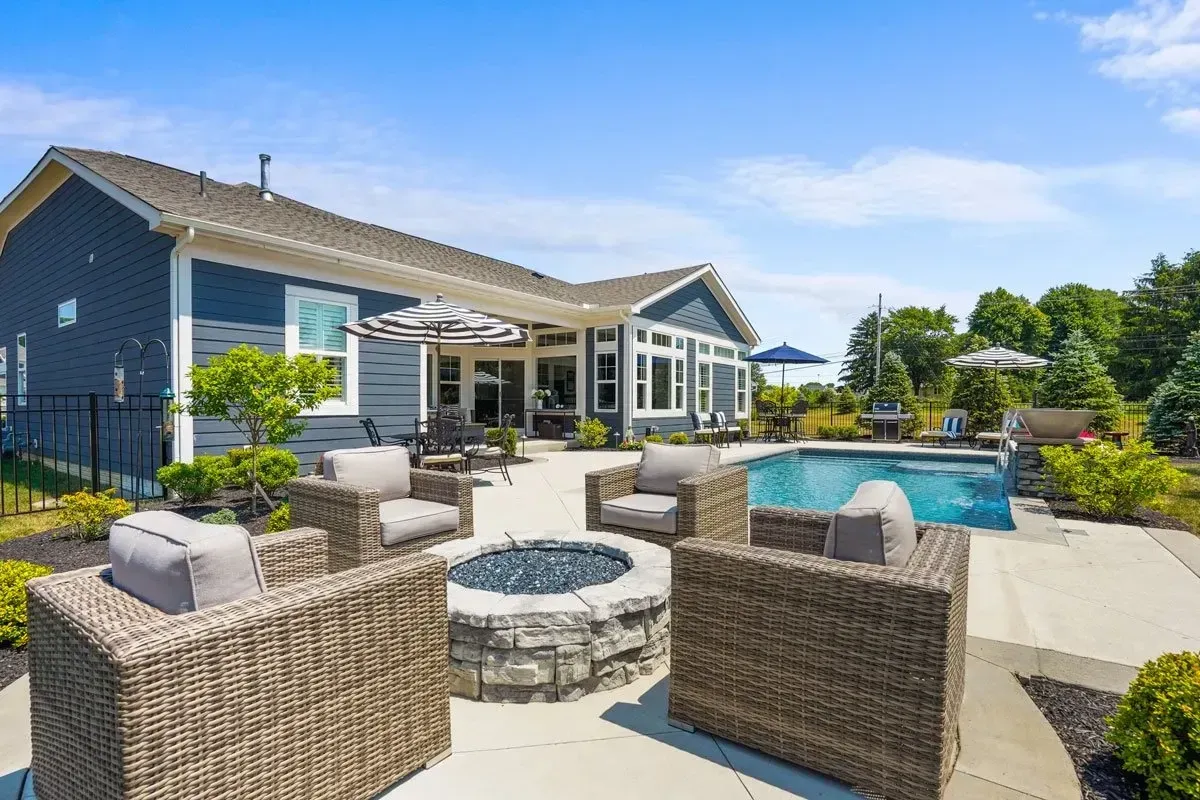
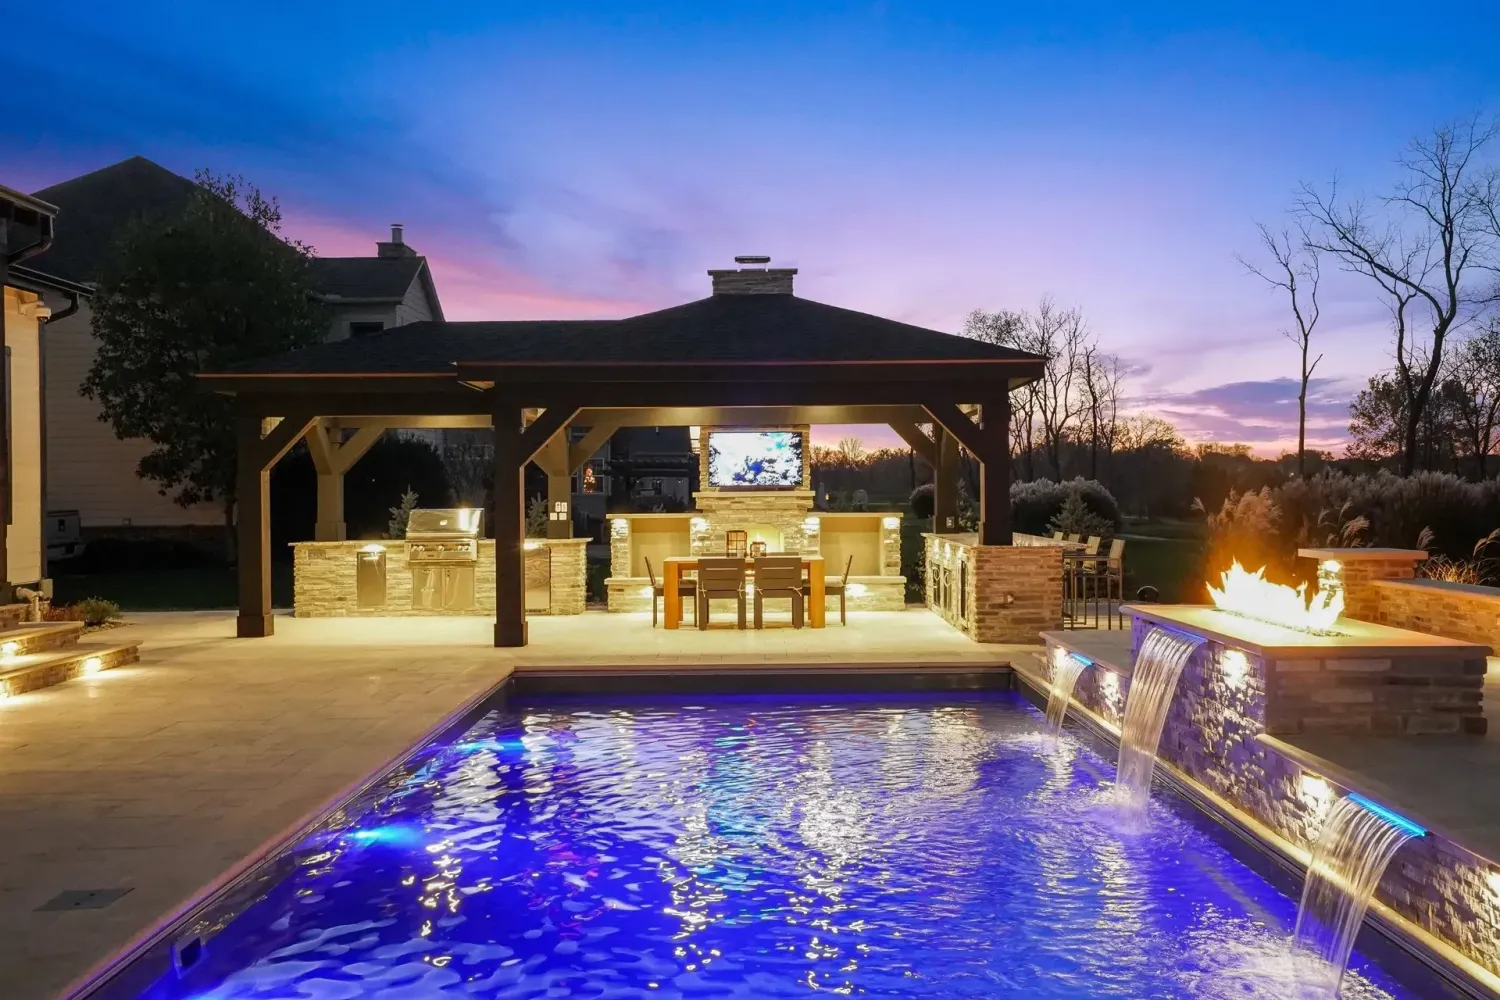
A finished Johns Creek backyard — the kind of $160K+ project that only books when your marketing makes you the safe choice.
Marketing budget isn’t a percentage. It’s a market-share decision.
You’ve probably read the standard advice — “spend 5% of revenue on marketing.” That number was invented for industries with $50 average tickets and predictable repeat purchase. It has nothing to do with selling $163,000 backyards in Johns Creek.
The real question isn’t “what percentage of revenue.” It’s “what level of spend buys me category dominance in Johns Creek for the next three years?” Because once you own the top three Map slots and rank for “pool builder Medlock Bridge” and “luxury pool Rivermoore Park,” your cost per lead drops every month while your competitors keep paying retail.
The Johns Creek pool builder who out-spends his competitors today builds the marketing moat that pays him for the next decade. The one who under-spends is paying that builder’s mortgage.— What 12 months of Johns Creek pool data tells us
For pool builders doing $1.5M–$5M in revenue and serious about scaling into the St. Ives, Country Club of the South, and Bellmoore Park luxury tier, the working number we see is $5,800 to $7,200 per month. Above that and you’re either in growth mode or you’re wasting money on the wrong channels. Below $3,500, you’re not buying enough surface area to compete with the four other contractors already entrenched here.
Three buckets. That’s where the $6,400 goes.
Every Johns Creek pool builder spending serious money on marketing splits it across the same three buckets. Get the mix right and the spend compounds. Get it wrong and you’ll feel rich for 90 days and broke by month five.
The mix that actually works in Johns Creek.
None of these buckets work alone. Paid ads without organic content burn cash. SEO without a converting site wastes the traffic. Content without the funnel underneath is just art class. The whole engine has to fire together.
SEO + Google Business Profile dominance.
Roughly $2,800 of the $6,400 lives here. This is the long-tail asset — neighborhood pages for Medlock Bridge, Rivermoore Park, St. Ives, and Bellmoore Park, schema markup, citation building, monthly content, GBP optimization, review acquisition. It takes 4–7 months to fully ignite, and once it does, your cost per inbound lead drops every month for years. Most pool builders skip this bucket because the payoff feels too far away. The ones who don’t, win Johns Creek.
Owned-funnel paid ads.
About $2,240 — Google LSAs, branded search defense, and Meta retargeting going to your site, not Angi. Produces inbound calls in week two while SEO ramps. Exclusive leads, no bidding wars.
Content + social proof.
The remaining $1,360 funds drone shoots, time-lapse builds, and short-form video of finished Johns Creek projects. Content is what makes a $163K homeowner trust you before they even call.
What happens if you skip a bucket.
Skip SEO and you’ll pay paid-ad rates forever. Skip paid ads and you’ll wait 9 months for your first qualified inbound. Skip content and your close rate stays under 15% because homeowners can’t see what they’re buying. The compounding effect comes from running all three at once — and that’s why $6,400 returns 7.3x while $2,000 returns 1.4x. It’s not the spend level. It’s the architecture.
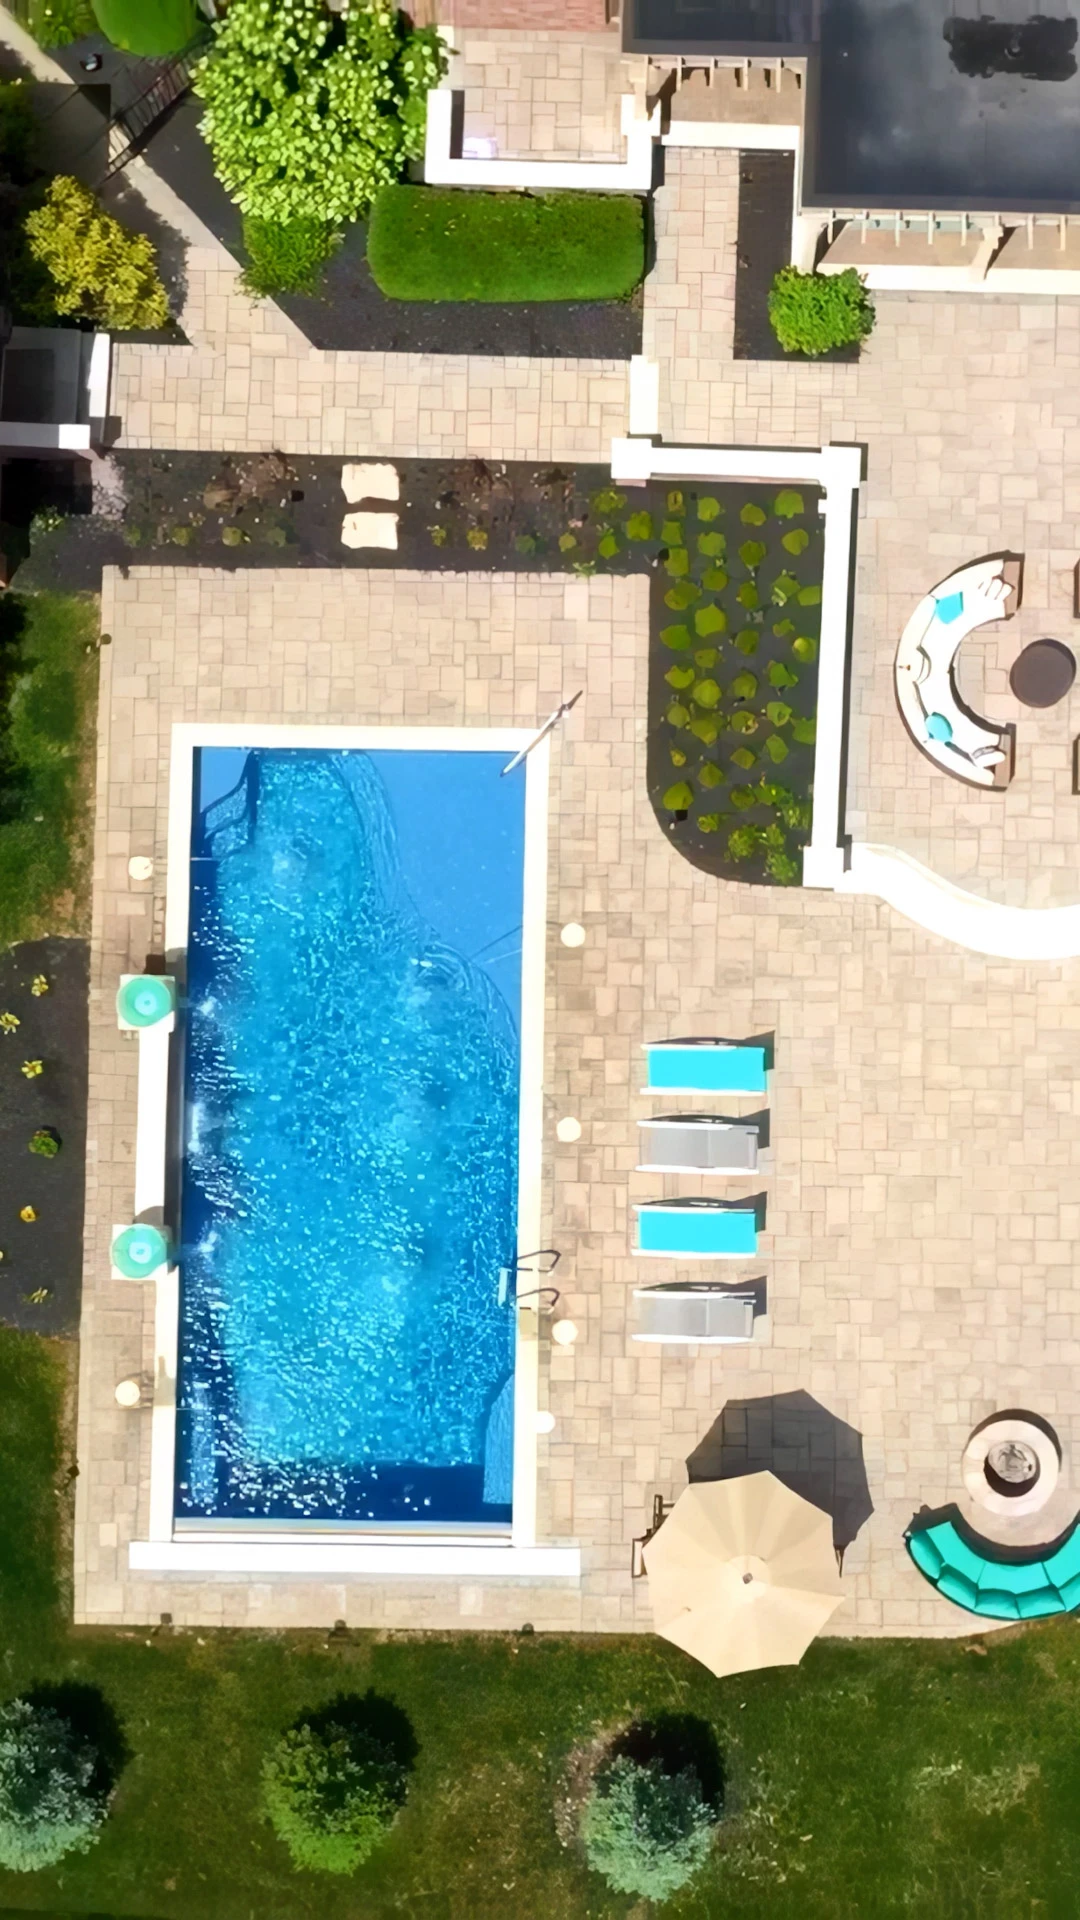
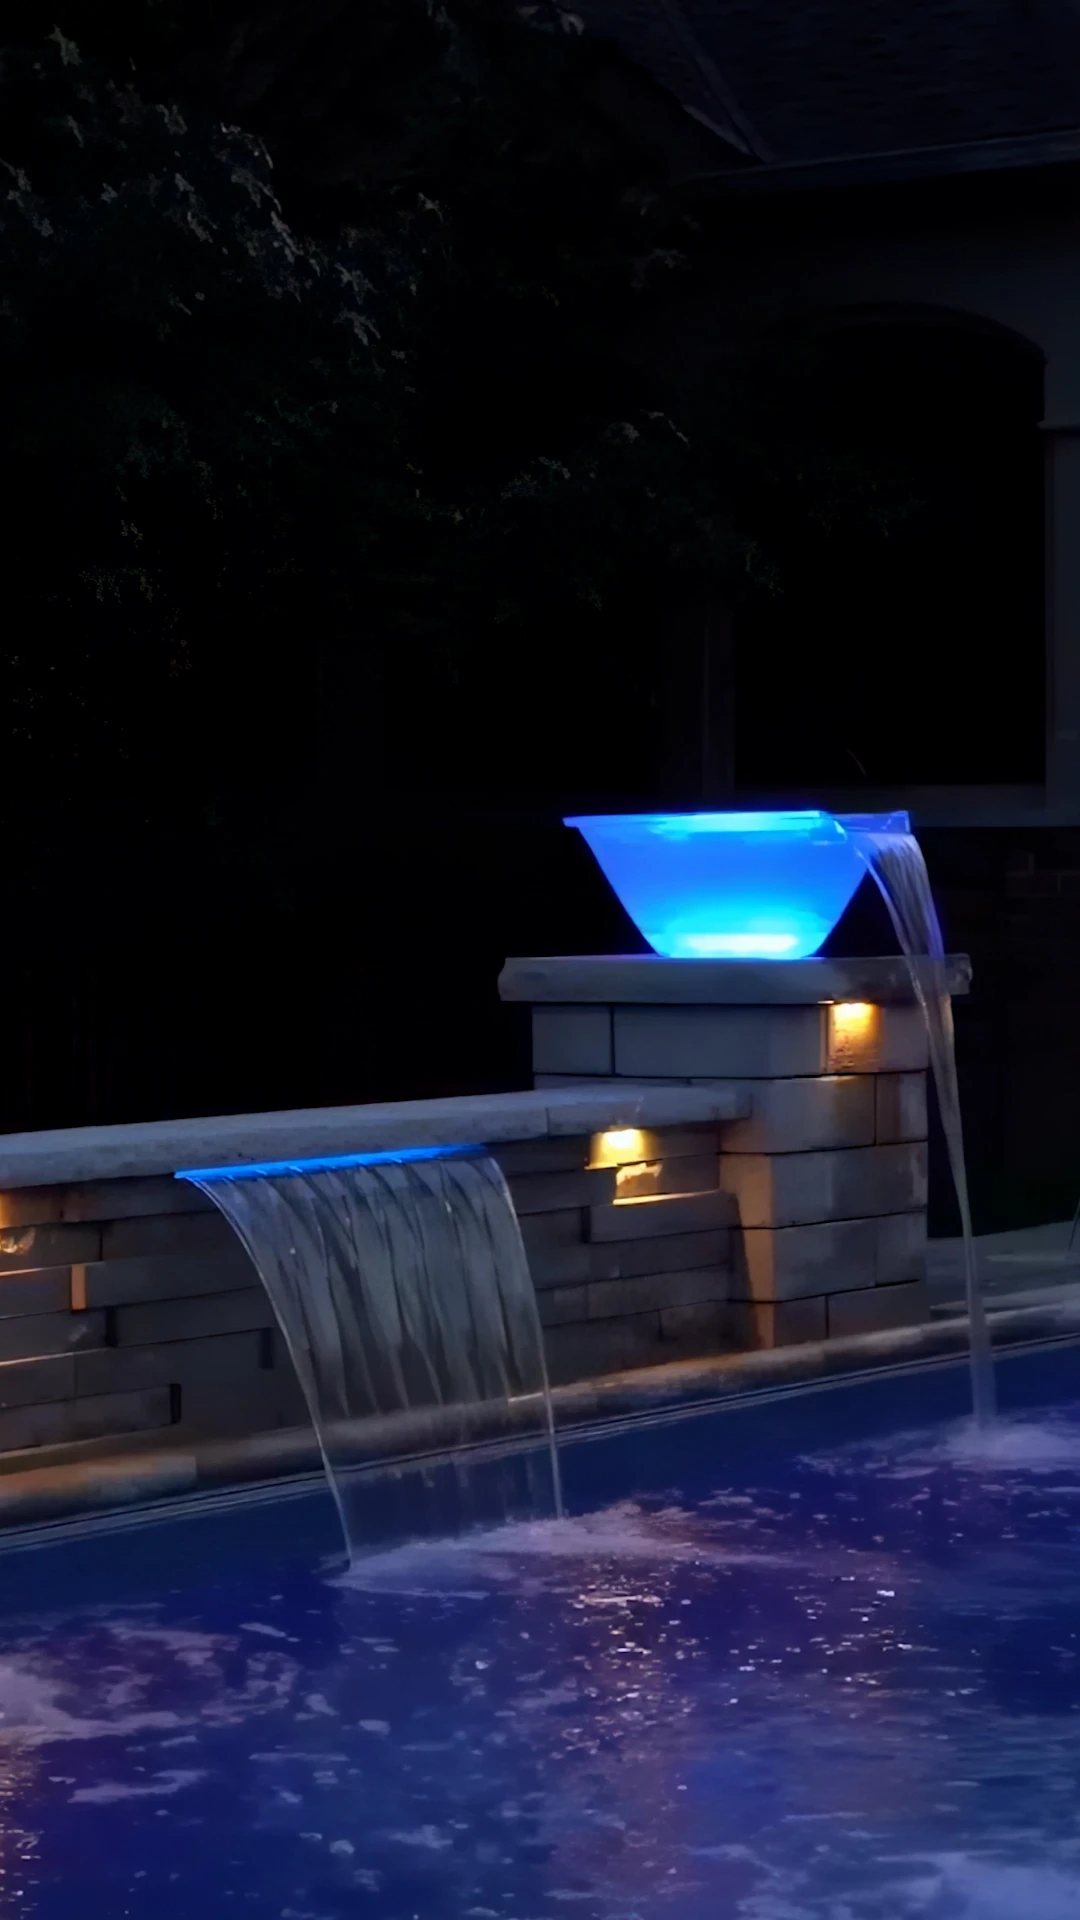
Aerial of a Johns Creek pool the week of completion — assets like this become 8–10 indexed marketing pieces.
How we set a Johns Creek pool builder’s marketing budget.
Audit current spend
We pull every dollar going out the door — Angi, HomeAdvisor, Google Ads, Yelp, mailers, sponsorships, the lot. Tag each as exclusive vs. shared, owned vs. rented. Most Johns Creek builders find 30–40% of their current budget is producing under 5% of their booked work.
Reverse-engineer the comps
We map every pool builder ranking in the Johns Creek 3-pack and run a competitive spend estimate. The $6,400 figure isn’t a guess — it’s the median of what the contractors winning the Medlock Bridge, St. Ives, and Bellmoore corridors are actually paying.
Set the funded budget
We rebuild the spend across the 45/35/20 mix, kill the bleeding line items, and set a 12-month ramp. By month 6 you should be running cheaper exclusive leads. By month 12 the funnel pays for itself even if you cut paid ads in half.
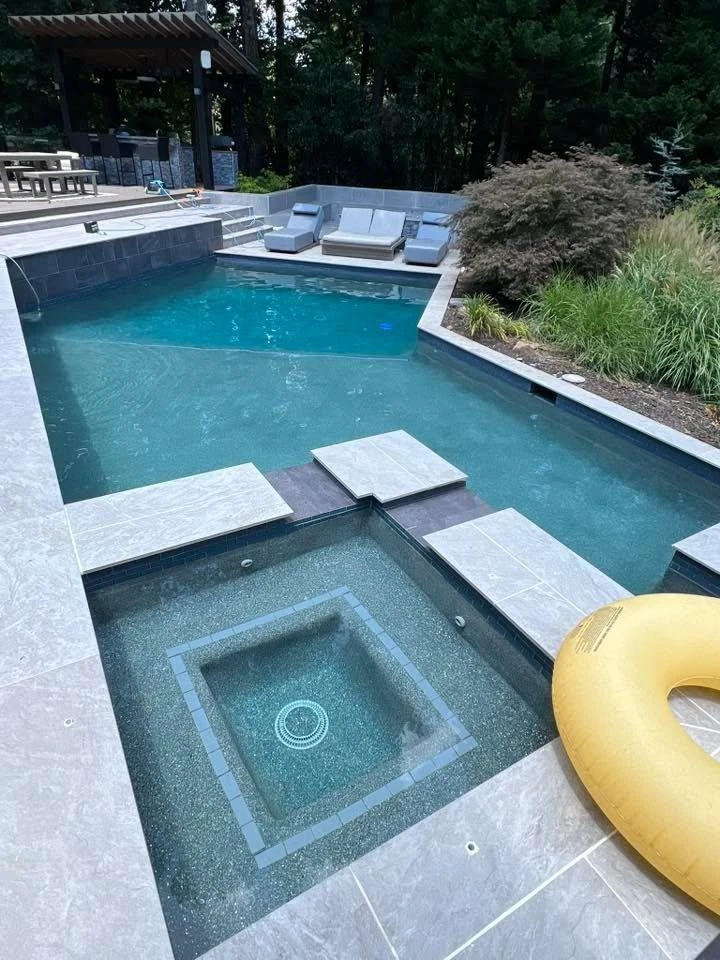
Mid-build documentation — the visible-process content most pool builders never capture.
The Rivermoore Park pool builder who almost doubled the wrong way.
A pool contractor serving the Rivermoore Park and Medlock Bridge corridor was about to take his $2,100/month Google Ads spend to $4,200 — same channel, just more of it. We rebuilt his budget at $6,400 across the full mix instead. Eleven months later: organic site traffic up 873%, 14 inbound calls/wk from his own funnel, average booked project value up from $94K to $163K because the content was attracting a different homeowner. His blended cost per booked project dropped from $1,847 to $612. Same market he’d been working for nine years — different math.
Booked Johns Creek pool projects, month over month.
The first 90 days look like spend with little return. Months 4–9 are where the funded budget breaks away from the under-funded one. That’s the line most contractors give up before reaching.
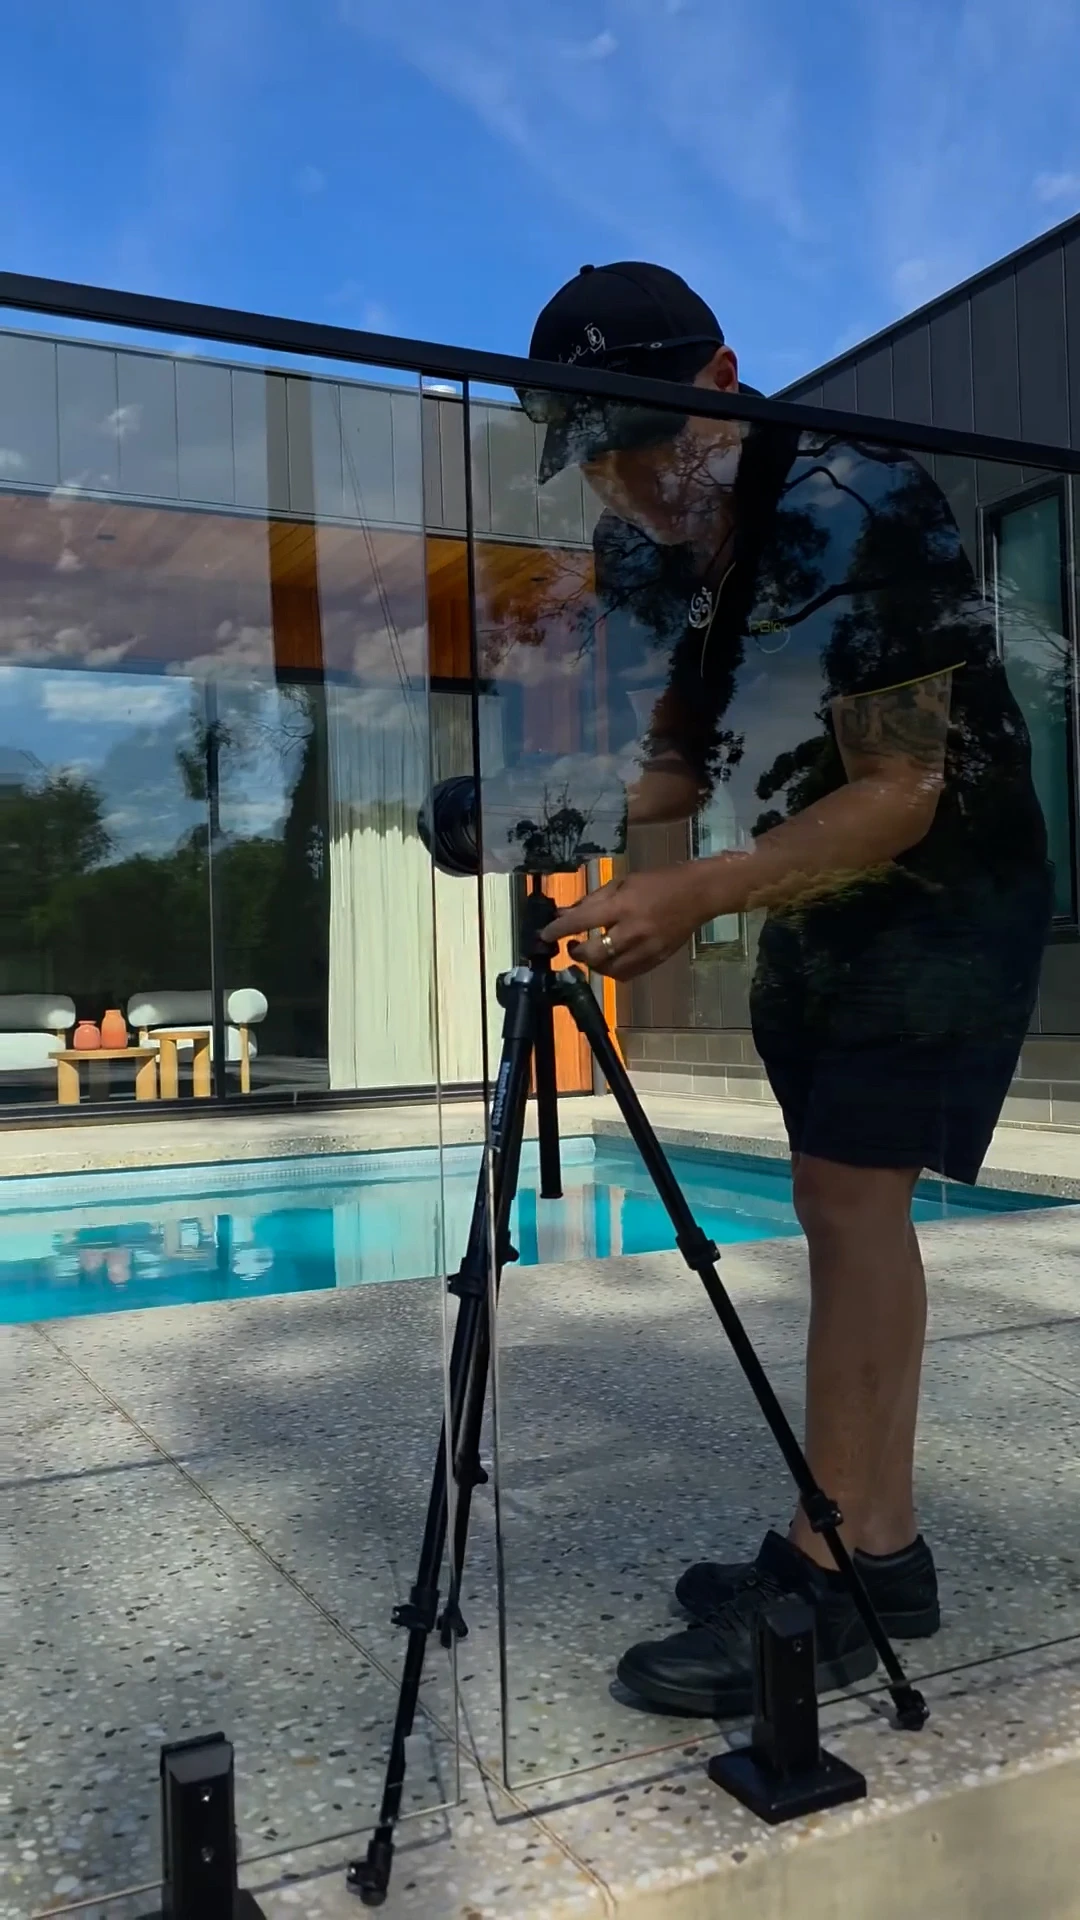
Behind the scenes — every Johns Creek build we shoot turns into months of organic content.
Six questions to ask before you commit a marketing budget.
Whether you’re going to spend $2,000 or $9,000, run through these six questions first. Skip them and you’ll be back here in eight months wondering where the money went.
“What’s my average project value, really?”
If your average is $94K, a $2K budget can work. At $163K average, $2K is structurally too low. The budget has to match the project size.
“What % of revenue is currently going to marketing?”
Most Johns Creek pool builders we see are at 1.4–2.1% of revenue. The contractors growing 25%+ year over year sit at 4–6%.
“Where am I exposed if Angi disappears tomorrow?”
If 60%+ of your leads come from a single platform, your business has counterparty risk. Owned channels reduce that to zero.
“Can I sustain spend through a 4-month dip?”
SEO ramps slowly. If your cash flow can’t survive 90 days of spend before lead volume responds, start with a smaller funded budget — not a bigger underfunded one.
“What’s my close rate by source?”
If shared leads close at 8% and exclusive leads close at 31%, the same dollar spent on exclusive is 3.8x more valuable. Track by source or you’re flying blind.
“Who’s the agency actually accountable to?”
You should see a real-time dashboard with inbound calls, form fills, booked consults, and CPL by channel. If it’s a monthly PDF, walk.
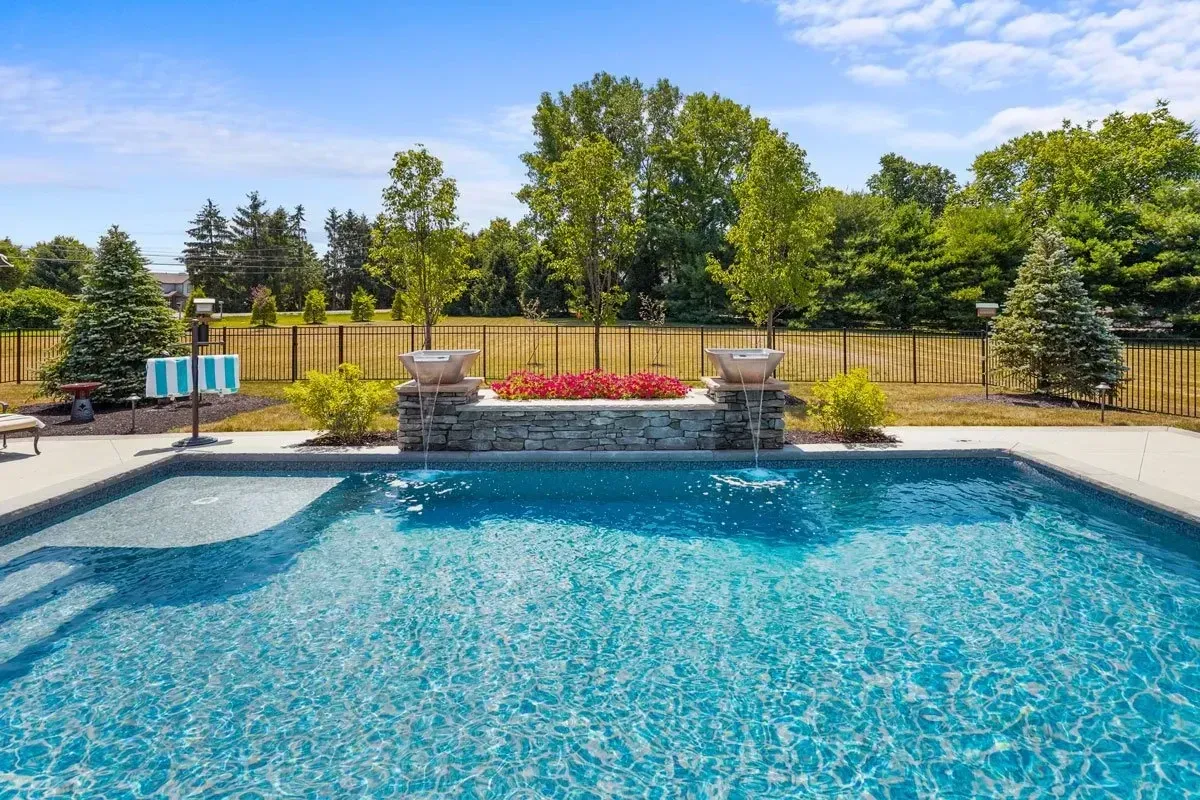
A completed Johns Creek build — the kind of project that pays for a year of marketing in a single sale.
What Johns Creek pool builders keep asking us.
It’s the median for top-10 ranked Johns Creek pool builders, not a magic number. If you’re targeting $1.5M–$5M revenue with $120K+ average projects, that range works. If your average ticket is closer to $80K, you can run a leaner version at $3,200–$4,000. The principle is matching spend to project size and market depth.
Then run a focused two-bucket version — heavy on SEO foundation work for the first 6 months and a small Google LSA budget. Skip the content production until cash flow loosens up. Underfunded full-funnel beats overfunded single-channel every time.
Paid-ad inbound calls within 2 weeks. Real SEO traction by month 4. Full ramp to 9–11 booked projects/month by month 9–10. Anyone promising faster on the SEO side is selling you ads disguised as organic.
Not on day one — keep them on a smaller spend for the first 90 days while owned-channel ramps. By month 6 most of our pool builders cut shared-lead spend by 70%, and by month 12 they’ve usually killed it entirely. The quality difference between exclusive and shared makes the migration easy.
No. One pool builder per city, full stop. We will not run marketing for two pool builders in Johns Creek or two in Alpharetta at the same time. That’s the conflict-of-interest line that makes category dominance a real promise.
See what your real Johns Creek marketing budget should be.
30-minute call. We pull your current spend, the top three Johns Creek pool builders ranking against you, and the funded number that closes the gap. Free, no follow-up sales sequence. We do these every week with contractors across North Atlanta and the broader Metro market — see also our pool builder industry hub.