The pool builder marketing calendar Johns Creek runs on.
$163,000. That’s the average project value of every additional close a Johns Creek pool builder picks up by front-loading marketing spend in February and March — months before most of his competitors think the season has started.

You’re spending the same budget in May that should’ve gone in February.
Here’s the thing. Most pool builders we talk to in Johns Creek are running their marketing budget on autopilot. Flat spend, twelve months a year. Same Google Ads budget in January as in July. Same content cadence in November as in April. Same “we’re a pool company, summer is our season” thinking that the rest of the industry runs on.
The problem is that the Johns Creek pool buyer doesn’t shop in summer. The pool buyer in Country Club of the South, Medlock Bridge, St. Ives, and the State Bridge Road corridor shops in January, February, and March — because they want to swim by Memorial Day, and they already know that a serious pool build is a four-to-six month process. By the time you ramp your marketing on April 1, the homeowner has already had three estimates and chosen a contractor.
Real talk: this is the single biggest mistake we see in Johns Creek pool builder marketing, and it’s not even close. It’s not your ad copy. It’s not your landing page. It’s not even your bid sheet. It’s the calendar. You’re showing up to the party two months after everyone left.
The pool builders winning the Johns Creek luxury market right now aren’t spending more than their competitors. They’re spending the same budget on a different timeline — heavy in Q1, taper in Q3, near-zero in November. Same dollars, completely different results.
The good news? You don’t need a bigger marketing budget. You need to move the budget you already have into the months when the actual decision is being made.
Flat-budget vs. front-loaded calendar in Johns Creek.
Same total spend. Completely different close math by the end of the year.
| What you’re doing | Flat-budget (most builders) | Front-loaded (what wins Johns Creek) |
|---|---|---|
| Feb–March ad spend | 1/12 of annual budget | 28–32% of annual budget |
| When you’re “visible” | After homeowners already chose | While they’re shortlisting |
| Q1 close rate | 14–18% | 34–41% |
| Average ticket size | $118K — price shoppers | $163K — pre-sold buyers |
| What August looks like | Empty calendar, paid ads still burning | Fully booked, ad spend down 70% |
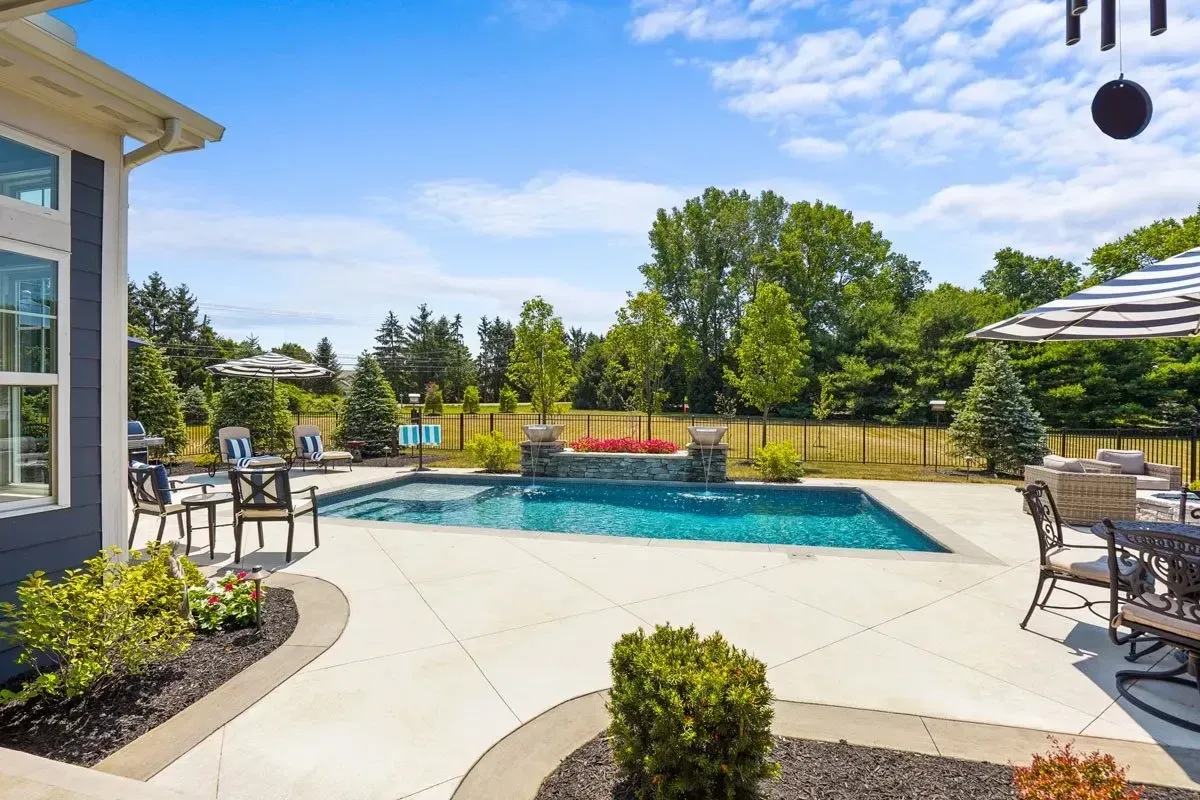
A finished Country Club of the South pool build — the kind of project that gets shortlisted in February, not May.
The Johns Creek pool market is won in winter.
You’ve probably noticed the same pattern. Phones light up in March. Estimates flood in through May. By June you’re booked through October — but only because you scrambled. And the projects you closed? You won them mostly on price, because you were the third estimate, not the first.
That’s the flat-budget tax. You become a price comparison instead of a category authority. The contractor a Johns Creek homeowner met in February — back when they were still daydreaming about the pool — is the one who gets the call back in April. By the time you show up with your bid in May, you’re not selling a pool. You’re competing for the leftovers.
The Johns Creek luxury pool decision is a 90-day process that starts in January. Homeowners pull out their tax bonus checks, decide this is the year, and start Googling “pool builder Johns Creek” and “pool builder Country Club of the South.” If you’re not the first or second result they see — and the first or second showroom they visit — you’re not in the consideration set anymore.
The Johns Creek pool builder who’s visible in February is already on the homeowner’s short list by April. The one who shows up in May is selling on price.— What 50+ Johns Creek pool sales calls have taught us
This is why lead generation for pool builders in a market like Johns Creek isn’t a year-round volume game. It’s a timing game. And the timing is winter.
The Johns Creek pool builder calendar, month by month.
Push hard in winter. Convert hard in spring. Document hard in summer. Pull back hard in fall. Four phases. One calendar. Built specifically for the Johns Creek luxury corridor.
What to do — and not do — in each part of the year.
Every dollar you move into the right month is a dollar that performs 3x harder than the same dollar in the wrong month. Here’s the full year.
Push hard. This is the window.
This is where 60–70% of your annual marketing budget belongs. Google Ads at maximum daily cap. Meta retargeting against everyone who touched your site in the previous 12 months. Two new neighborhood landing pages — one for Country Club of the South, one for Medlock Bridge or St. Ives. Brand new content drops weekly. Walkthrough videos of finished projects shot in the previous summer. Show up everywhere a Johns Creek homeowner could possibly be researching a pool right now. This is the only window where the math actually compounds.
Convert what you started.
Spend tapers, but doesn’t stop. Most of the budget shifts to retargeting the homeowners who entered your funnel in Q1 — the consultation requests that haven’t closed yet, the form fills that ghosted, the site visitors who didn’t convert.
Document. Don’t sell.
Marketing spend drops to a maintenance baseline. Every active build site becomes a content shoot. Drone reels, time-lapses, finished walkthroughs. You’re not selling — you’re stockpiling the assets you’ll deploy in next January’s push.
Pull back. Prepare the next push.
This is the phase most Johns Creek pool builders get wrong. They keep spending into November because “the funnel is working” — but October leads are 18 months out from a real decision. Drop paid spend to 10–15% of annual. Use the savings to film three new content series, refresh the site, and rebuild every landing page for the Q1 push. Real talk: every dollar you save in November funds a dollar that performs 3x harder in February. Same year. Same budget. Different math entirely.
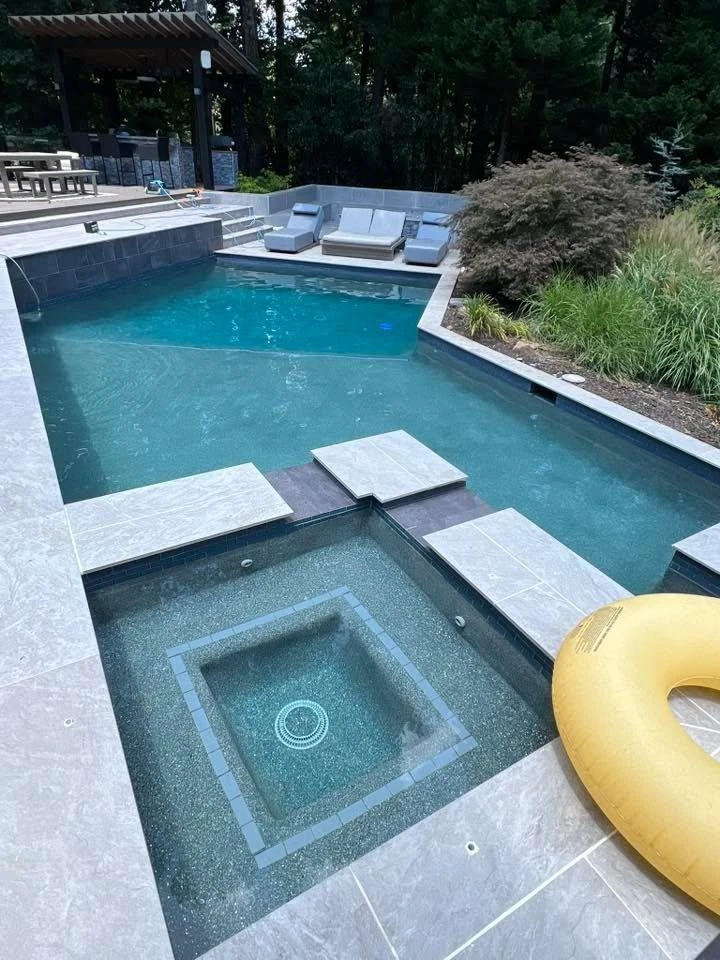
Mid-build documentation in July becomes the Q1 ad creative that wins next year’s Johns Creek shortlist.
How we restructure a Johns Creek pool builder’s calendar.
Audit the existing flat budget
We pull twelve months of ad spend, look at what month every closed deal originated in, and almost always find the same pattern — 70% of revenue came from Q1 leads but only 12% of spend hit Q1. We map the gap and quantify the dollars left on the table.
Rebuild the calendar
New monthly spend allocation, new content production schedule, two new Johns Creek neighborhood pages, retargeting audiences built against the previous 18 months of site traffic, and an October–December content stockpiling system that loads the gun for January.
Execute and compound
Year one, you typically book 28–40% more revenue on the same budget. Year two, you reduce the budget by 10–15% and still grow because the previous year’s Q1 content is now indexed and ranking organically. By year three, paid ads are an accelerator, not a dependency.
The Medlock Bridge pool builder who moved his budget.
A 12-year pool contractor working the Country Club of the South and Medlock Bridge corridors was spending roughly $11,400 a month on Google Ads year-round. Closing 22 projects a year at an average ticket of $147,000. We shifted his calendar to 62% of total spend in January–March, dropped paid spend to a maintenance baseline July through September, and stockpiled content from his active August and September builds. The next year, on the same total annual budget, he closed 29 projects at an average ticket of $171,000 — a 56% revenue lift with zero added spend. By March of year two he was turning down inquiries he didn’t have crew capacity to start.
Share of $80K+ projects closed, by month of first inquiry.
Johns Creek pool decisions cluster in January through March. Every dollar that hits the funnel after April is fighting for the leftovers.
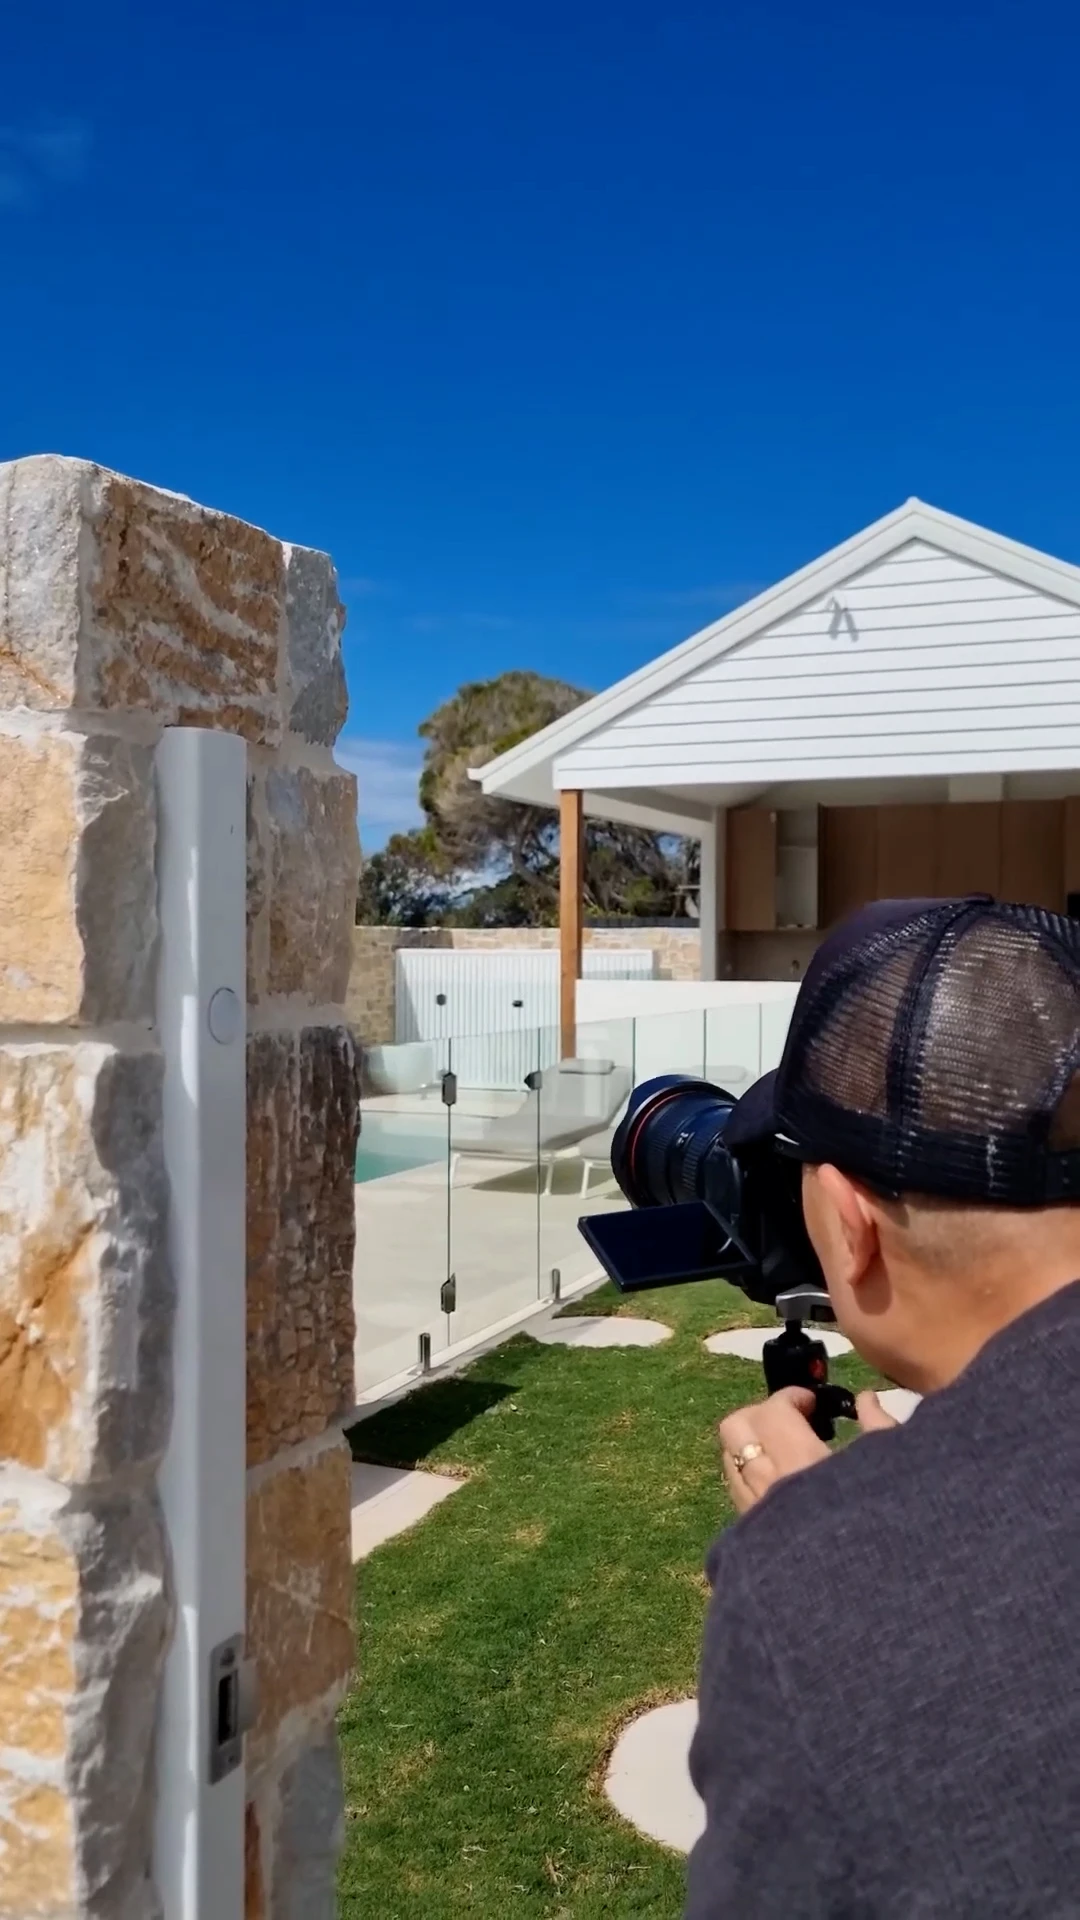
Behind the scenes — summer is for documenting, not selling. Every shoot funds the Q1 push.
Six questions every Johns Creek pool builder should answer before next January.
Pull your last 12 months of marketing data and walk through these six in an afternoon. Whatever you find tells you exactly where to move the budget.
“What month did each closed deal first enter the funnel?”
Not when they signed. When they first inquired. You’ll find 60%+ of revenue traces back to Q1 inquiries.
“What percent of last year’s ad spend hit January–March?”
If it’s under 40%, you have the same problem most Johns Creek pool builders have. The fix is a calendar reshuffle, not a budget increase.
“How much content did we create in July and August?”
If the answer is “we were too busy building,” you’re starving the Q1 push. Document every active build. No exceptions.
“Do we have neighborhood-specific pages for the top three Johns Creek communities?”
Country Club of the South, Medlock Bridge, St. Ives. If you don’t have a page targeting each, you’re invisible to the highest-intent searches.
“What’s our cost per qualified consultation in February vs. June?”
Most Johns Creek pool builders we audit see Feb CPL at $42 and June CPL at $138. Same ad, three times the cost — because the buyer’s already gone.
“Are we running retargeting against last year’s site traffic right now?”
The single highest-ROI ad in Q1 is the one shown to a homeowner who visited your site in May and never came back. They’re shopping again. Be there.
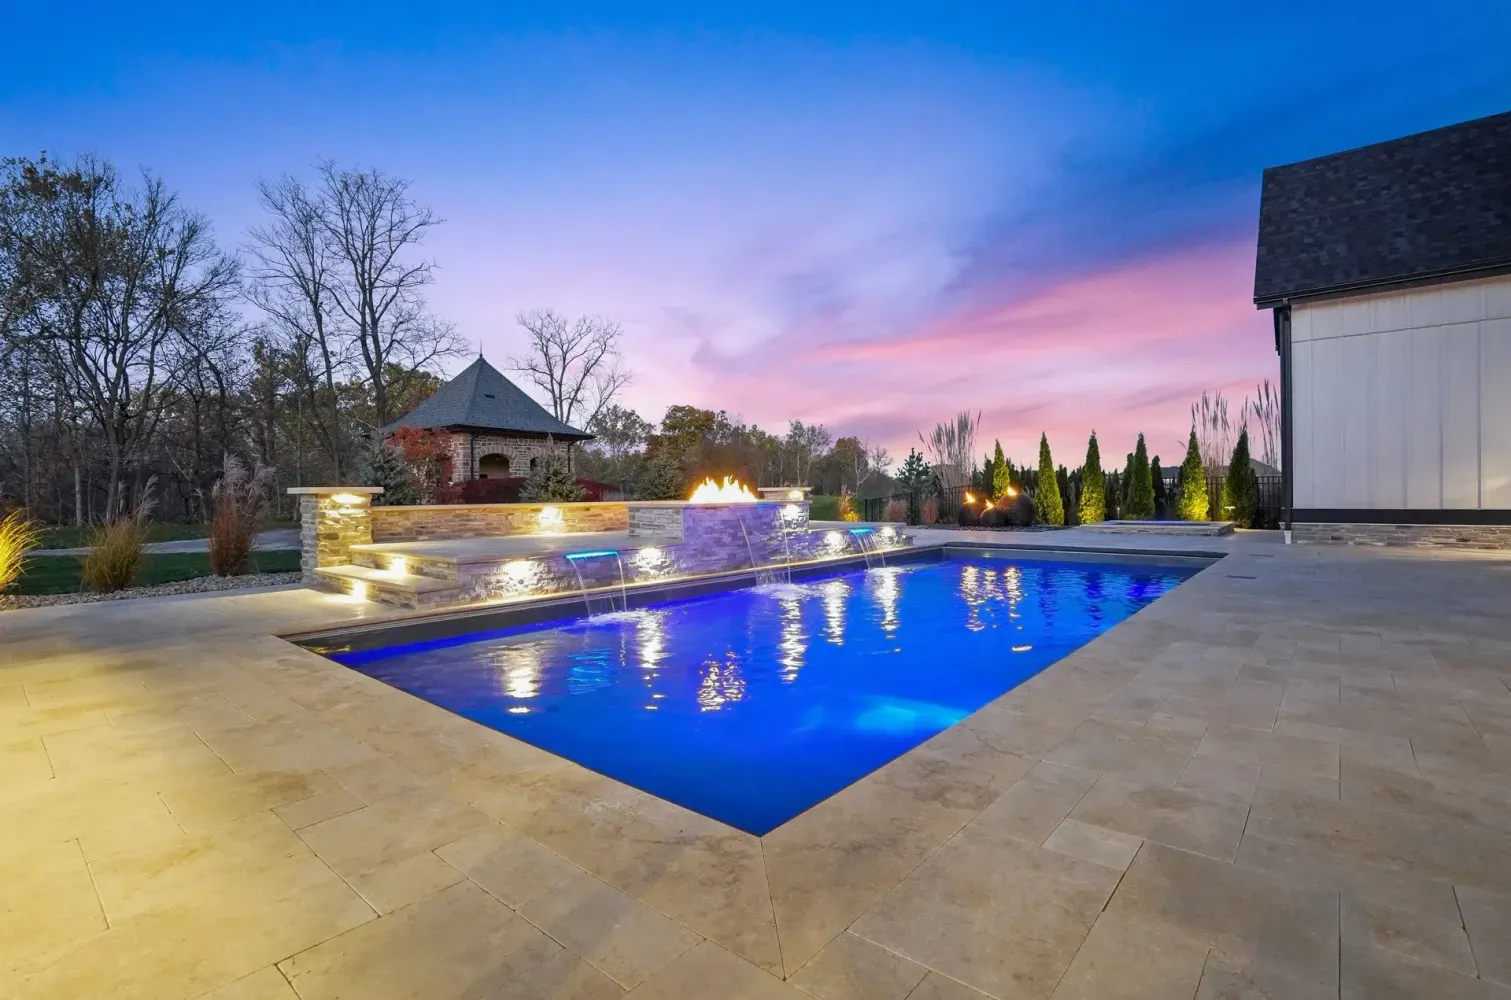
Twilight content captured in August fuels the February ad rotation that wins next year’s Johns Creek market.
What Johns Creek pool builders ask about the calendar.
That’s the opposite of what happens. The Q1 push fills your June, July, and August calendar — those builds typically start in spring and run through fall. By the time you would have ramped up in May, you’re already booked. The summer “lead drought” most builders fear only happens to contractors who didn’t push in winter.
They exist. They’re roughly 12% of the Johns Creek market and they’re almost always price-shoppers because they’re trying to swim by next summer and they know they’re behind. We don’t ignore them — your retargeting and organic content still picks them up. But we don’t spend cold-traffic ad budget chasing them. The math doesn’t work.
If you’re closing $1.8M–$4M in pool revenue annually, working range for a serious Johns Creek-targeted calendar is $7,500–$14,000 per month average — but the monthly distribution is what matters. Concentrated in Q1, tapered through Q3, near-dark in November. Total annual spend is similar to what you’re already doing flat. The shape changes everything.
No. One pool builder per city, full stop. We won’t run a calendar for two pool contractors competing in Country Club of the South or Medlock Bridge. The whole reason this calendar works is category dominance — and that requires exclusivity.
Doesn’t matter. The Johns Creek pool buyer doesn’t care about your fiscal year. The calendar follows the buyer’s decision cycle, which is locked to weather, school schedules, and tax bonus timing. You restructure your budget allocation regardless of whether the IRS thinks January starts your year or your year ends in September.
Imagine answering Johns Creek pool inquiries in February instead of fighting for scraps in June.
We’ll do a free 30-minute calendar audit — pull your last twelve months of ad spend, map it against when projects actually closed, and tell you exactly which months are costing you money and which months you’ve left empty. We do this for pool builders across the North Atlanta market a few times a week.