The roofer marketing calendar for Marietta, GA.
A Marietta roofer tracked every job he booked over 3 years and discovered something that changed how he runs his entire business: 61% of his annual revenue came in a 9-week window between April and early June.
Your flat marketing budget is the wrong shape for the Cobb County storm cycle.
Here’s the thing. The majority of Marietta roofers we talk to run a flat monthly marketing budget — $3,200 in January, $3,200 in March, $3,200 in August, $3,200 in November. It feels disciplined. It looks clean on a spreadsheet. And it is exactly the wrong shape for how roofing decisions actually get made in Cobb County.
Real talk: Marietta isn’t a flat market. Spring storm season concentrates roofing decisions into a 9-week window like almost nothing else in home services. From mid-April through early June, the volume of “I need a roofer right now” searches in the Marietta metro can jump 4–7x baseline. And then it crashes. By July, the urgency is gone. By August, you’re running ads against homeowners who are thinking about back-to-school, not their roof.
So the flat budget over-funds January through March (when nobody’s searching) and under-funds April through June — the exact 9 weeks that drive 61% of your year. You wake up on May 14th, look at your funnel, and realize you’re not in the consideration set for the storm cycle that’s already 3 weeks old.
The Marietta roofer booked for the year by Memorial Day isn’t running a bigger budget. He’s running the same budget — compressed into the right window. Pre-storm pre-positioning beats post-storm scramble, every time.
The good news? Once you map your marketing curve onto the Cobb County storm calendar, the math gets simple. Spend less in the slow months. Spend hard during the window. Spend post-window on review collection and content. The rest of this guide is the calendar.
The flat-monthly calendar vs. the storm-cycle compression
Same annual spend. Wildly different booked jobs by July 1.
| What you’re funding | Flat budget (most Marietta roofers) | Storm-cycle compression (what we run) |
|---|---|---|
| Spend in Apr–May–Jun | $9,600 (25% of year) | $23,400 (61% of year) |
| Cost per qualified inbound call | $162 — under-funded peak | $58 — share-of-voice dominance |
| Average ticket booked | $11,200 — reactive single-roof | $24,800 above — full-system insurance jobs |
| Crew schedule by June 15 | Half-loaded, chasing leads | Booked solid through August |
| Off-season spend | Same as peak — wasted | Cut 60%, redirected to content |

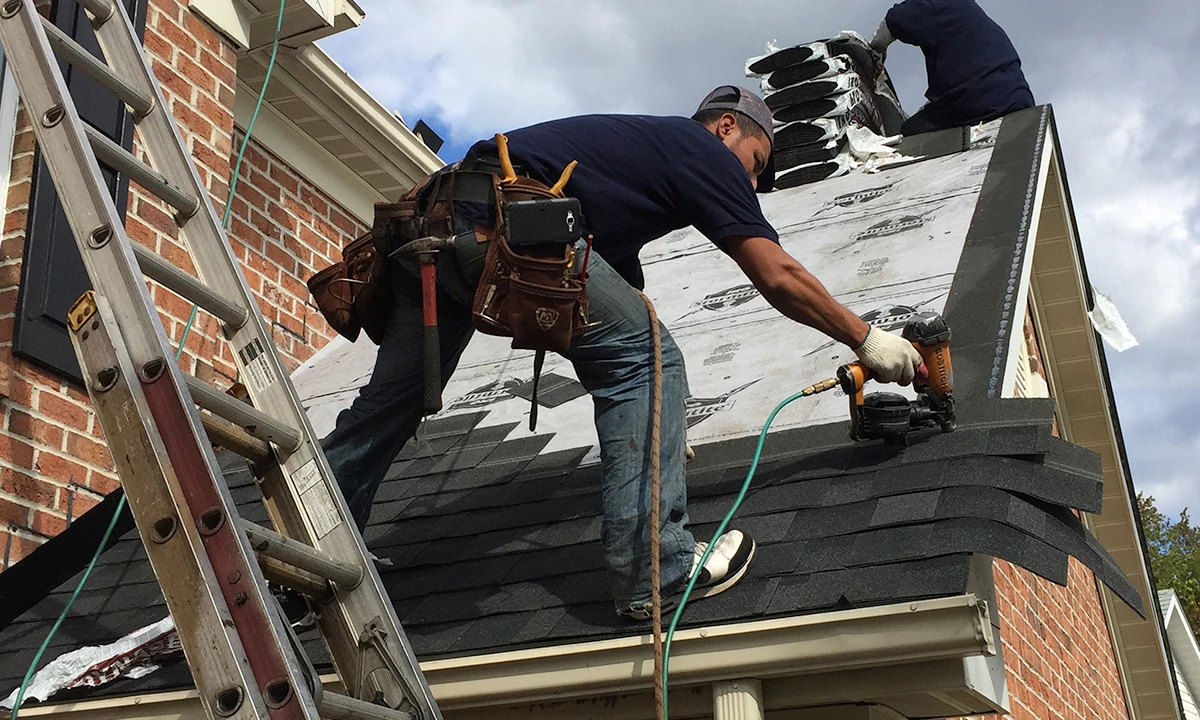
A Cobb County re-roof in peak season — the kind of job that books in the 9-week storm window.
You aren’t selling roofs. You’re selling speed.
You’ve probably noticed that the homeowner who calls 11 days after the storm isn’t the same homeowner who calls 11 hours after it. The 11-hour caller has water in the ceiling and an insurance adjuster lined up. The 11-day caller has three estimates already and is shopping for $400 off.
That’s the whole game in Marietta roofing. The first roofer the homeowner sees in their Google search, on their Facebook feed, or on the side of a competitor’s truck after a storm is the one who gets the call. Not the cheapest. Not the most experienced. The one who showed up first.
That means your ad spend needs to be front-loaded into the pre-storm and immediate-post-storm windows, not spread out evenly. When the radar lights up Cobb County on a Tuesday afternoon in May, your ads should already be running. Your retargeting should already be primed. Your Google Business Profile should already be ranked. The roofers who win post-storm preparation, win the storm.
The Marietta roofers booking $50K full-system jobs in May built their pipeline in April. The ones quoting $9,800 single-roof replacements in June built nothing.— What 3 years of Cobb County roofing data tells us
Pulling back in July, August, and September doesn’t mean going dark. It means redirecting budget into content production, review collection, and roof-aging educational content that warms the next storm cycle’s audience. Same dollar — totally different shape.
Nine weeks make the year. Match your budget to the nine weeks.
Marietta roofing is the most concentrated calendar in home services. Run a flat budget and you’re under-funded when the money’s on the table and over-funded when nothing’s happening.
The Marietta roofing year, broken into four windows.
Every Cobb County roofer we’ve worked with wins or loses on the same four-phase calendar. The shape of your spend curve matters more than the size of your spend.
The 61% window. Hit it hard.
This is where 61% of your annual revenue lives. Push 50–55% of your annual ad spend into these 9 weeks. Google Ads on “Marietta roofer near me” and “storm damage roof Cobb County.” LSAs maxed out. Meta retargeting against the pre-positioning audience built in March. Hyperlocal pages live for East Cobb, West Cobb, Sprayberry, and Powder Springs. The right lead-generation infrastructure in this 9-week window books the year.
Plant the seeds before the storms hit.
20% of annual ad spend. Goal: build the retargeting audience and SEO foundation that ranks before the April surge. If you ramp on April 14, you’re late. Pre-positioning is what makes the April push work.
Cut spend. Capture reviews. Stockpile content.
Crews are wrapping up storm-cycle jobs. Marketing spend gets cut 60%. Every install completed in June–August becomes a review request, a drone shot, and a case study. You’re building next April’s ammunition.
Capture the fall storm bump.
Cobb County gets a smaller — but real — fall storm peak in October and early November. It’s not the spring 9-week event, but it’s a 4–5 week mini-cycle that most roofers ignore entirely. 15% of annual spend, focused on Google Ads and LSAs, captures the secondary cycle. December is the only real dead month; use it for creative pre-staging and the storm-cycle audit.
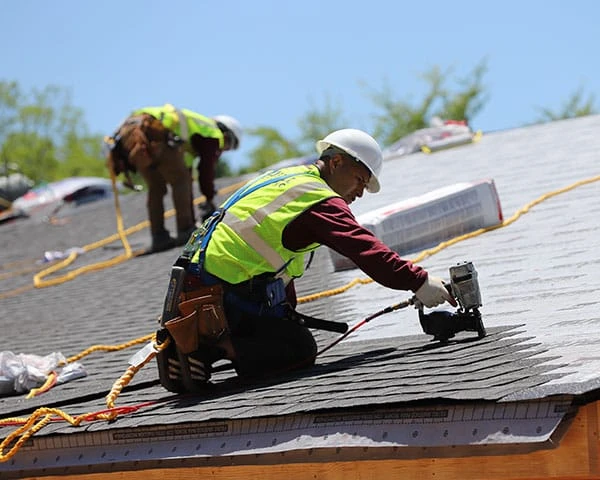
Mid-cycle estimate visit in Cobb County — content like this becomes pre-positioning ammo for next March.
How we shape a Marietta roofer’s year.
Plot 3 years of booked jobs against NOAA storm data
We overlay your job-signing dates against actual Cobb County storm-event data from the National Weather Service. The pattern is always the same: 9 concentrated weeks drive the year. Most roofers have never seen their business plotted this way.
Compress the budget curve
April 8 through June 10 gets 55% of the annual ad spend. February–March gets 20% for pre-positioning. July–September gets cut by 60% and redirected to content. October–November gets 15% for the fall cycle. December is for pre-staging.
Wire up storm-trigger automation
When NOAA shows a high-wind or hail event in Cobb County, we auto-launch a 72-hour ad push in the affected zip codes. The roofers who win the post-storm 48 hours win the storm. We make sure your bids, budget caps, and creative are pre-loaded for that moment.
The Cobb County roofer who stopped running flat.
A Franklin Road roofer was spending $58,000 a year on marketing — a flat $4,833 a month across 12 months. Booking about 84 jobs annually at an average ticket of $10,400, with 71% of revenue concentrated in May–July (delayed bookings from the spring window). We replotted his calendar against 3 years of Cobb storm-event data and compressed $32,000 of his spend into the April 8–June 10 window. Year-one results: 118 jobs booked, average ticket $19,600, full-system jobs (vs. patch work) up 184%, crew schedule locked through August by Memorial Day. He hasn’t run a flat budget since.
The shape of the year, plotted honestly.
Two-thirds of the year happens in April, May, and early June. A flat budget is a guaranteed way to be underfunded when the money’s on the table.
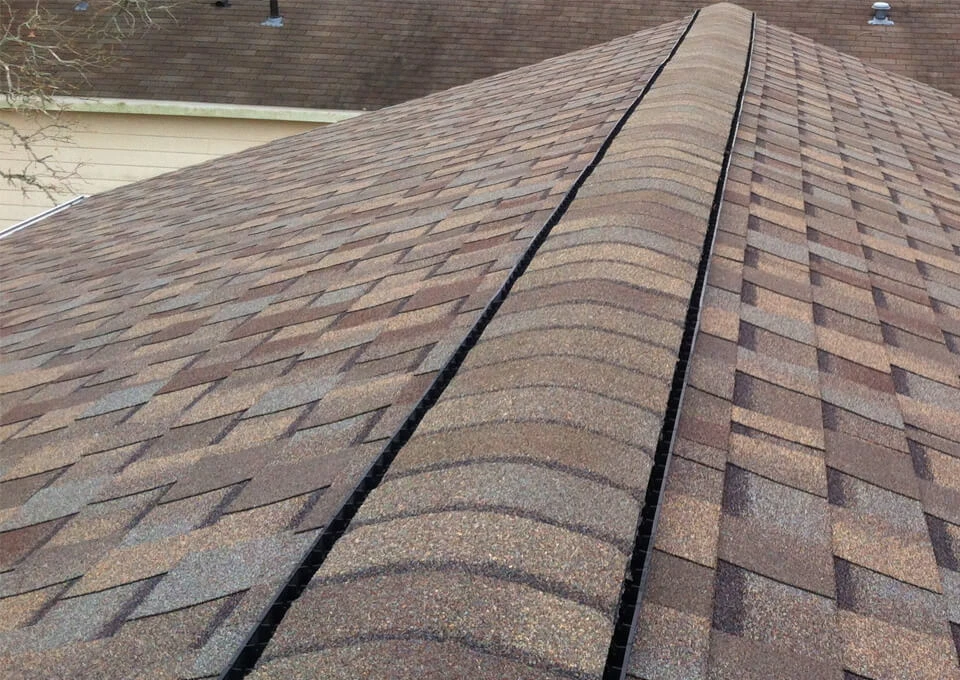
Material delivery on a Cobb County re-roof — every step of the install is content for the next pre-positioning cycle.
Six questions before you set next year’s roofing budget.
Run through these before you spend another dollar. If you can’t answer them, you’re funding a flat curve against a 9-week market.
What’s the date range of your peak signing window?
Plot your last 3 years. The cluster shows up immediately — usually 9 to 11 weeks tight around April–June for Marietta.
Is your March budget bigger than your November budget?
It should be. March is pre-positioning; November is the tail of the fall cycle. If they’re the same, your curve isn’t shaped right.
Do you have a storm-trigger automation in place?
When NOAA reports hail in Cobb, can you push budget into the affected zips within 4 hours? If not, you’re losing the post-storm 48-hour window.
Are you ranking for “Marietta roofer near me” by April 1?
If your SEO ramps in May, you’re already inside the window with no foundation. Pre-position in February and March.
What does your August content engine produce?
Every install completed in summer should generate review requests, drone shots, and educational explainers. August is content gold.
Have you defined what you do October–November?
The Cobb fall storm cycle is a real 4–5 week event. Most roofers ignore it entirely. 15% of budget there typically returns 22–28% of annual revenue.
A sunset crew shot — the asset that converts pre-positioning ads in March.
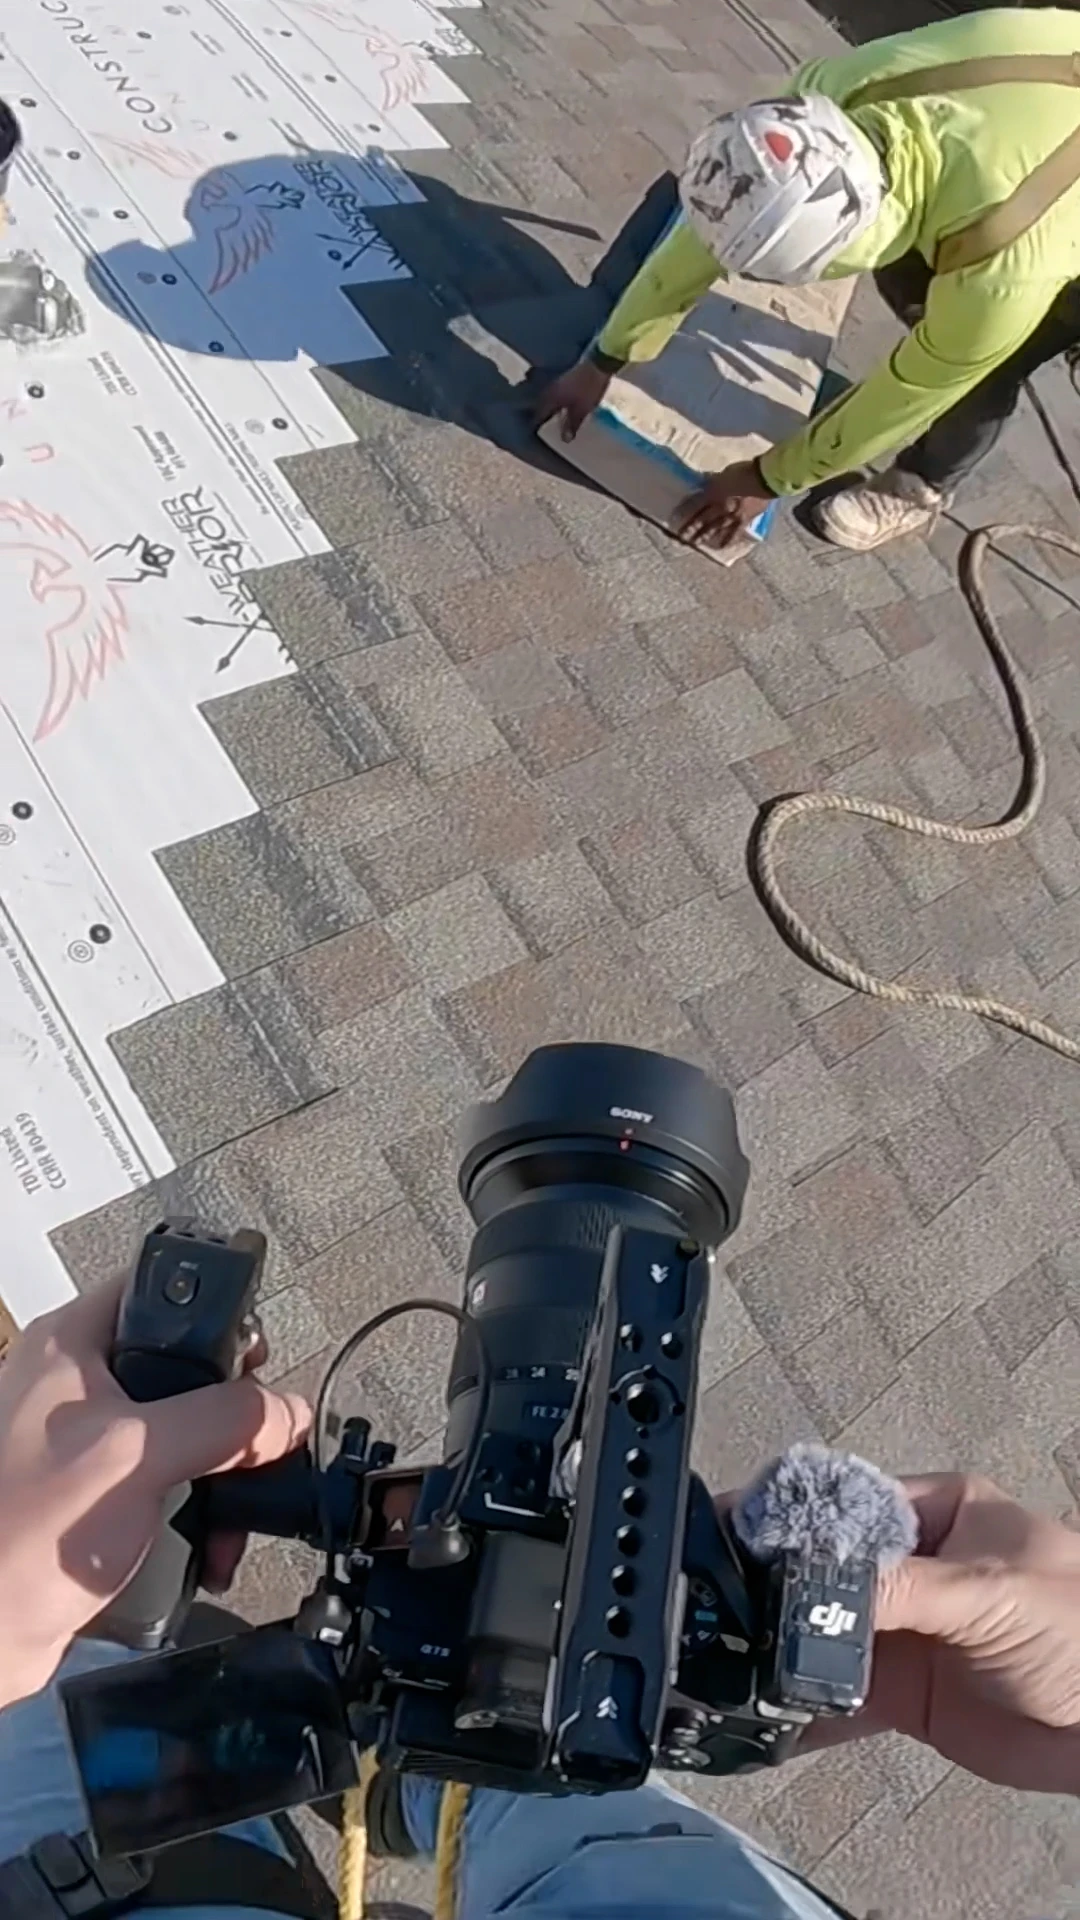
Behind the scenes on a Cobb County roofing shoot — every install day generates 10+ usable storm-season assets.
What Marietta roofers keep asking us about the storm-cycle calendar.
The window shifts a week or two annually, but the cluster pattern is remarkably consistent across the last 8 years of NOAA Cobb County data. Even in light-storm years, the 9-week April–June decision window holds — because aging roofs eventually trigger replacement regardless of any single storm event.
The opposite. Shared-lead platforms become slightly more useful in peak weeks because the volume is so high that some leads slip through under-bid. But the bulk of your peak-window spend should be owned-funnel ads (Google, LSA, Meta) where you control the cost per qualified call. Shared platforms stay flat; owned spend spikes.
February 1. Earlier and you’re spending against an audience that isn’t searching yet. Later than mid-February and you don’t have time to build the retargeting pool before April. Six weeks of pre-positioning is the sweet spot.
No. One roofer per geo, full stop. We won’t run marketing for two Marietta roofers simultaneously. That conflict line is non-negotiable.
Year-round, but at very different intensities. In-season social is conversion-focused (storm response, before/after, customer reviews). Off-season social is education-focused (roof aging signs, insurance claim explainers, material education) — which warms the audience that converts the following April.
Imagine your crews booked through August by Memorial Day.
If you want a 30-minute call where we overlay your last 3 years of signed jobs against NOAA Cobb County storm data and reshape your budget into the 9-week peak — that’s free. We do a few of these a week with roofers across the broader North Atlanta home-service market and inside the roofing vertical specifically.